Back
30 Aug 2019
USD/CHF technical analysis: 0.9890/95 to challenge buyers
- USD/CHF takes the bids near 38.2% Fibonacci retracement of April-August downpour.
- 200-day EMA, four-month-old falling trend-line acts as key upside resistance.
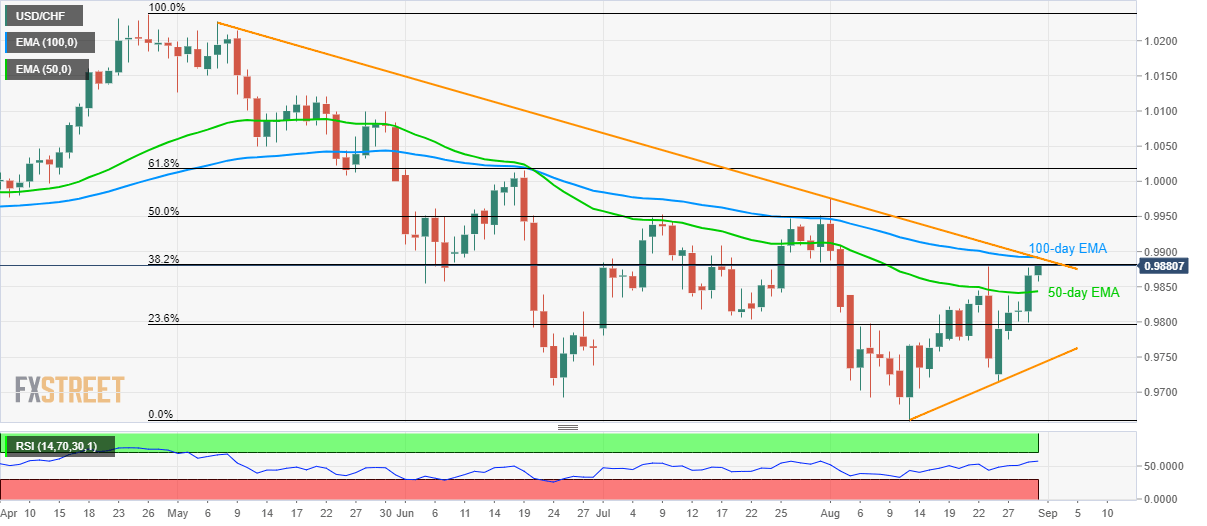
Despite breaking 50-day exponential moving average (EMA), USD/CHF remains below key resistance confluence as it takes rounds to 0.9880 during Friday’s Asian session.
The pair needs to provide a daily closing beyond 0.9890/95 region including 100-day EMA and four-month-old descending trend-line in order justify its strength.
In doing so monthly high surrounding 0.9975, 1.0000 round-figure and 61.8% Fibonacci retracement level of 1.0020 will flash on USD/CHF bulls’ radars.
On the contrary, a pullback below 50-day EMA level of 0.9844 can fetch prices to 0.9800 mark comprising 23.6% Fibonacci retracement. However, an upward sloping trend-line since August 13, at 0.9740, could question further declines.
USD/CHF daily chart
Trend: pullback expected