Back


8 Jan 2020
US Dollar Index Price Analysis: DXY reversing up, trades near 97.30 level
- DXY is ending the New York’s session on its high tick near the 97.30 level.
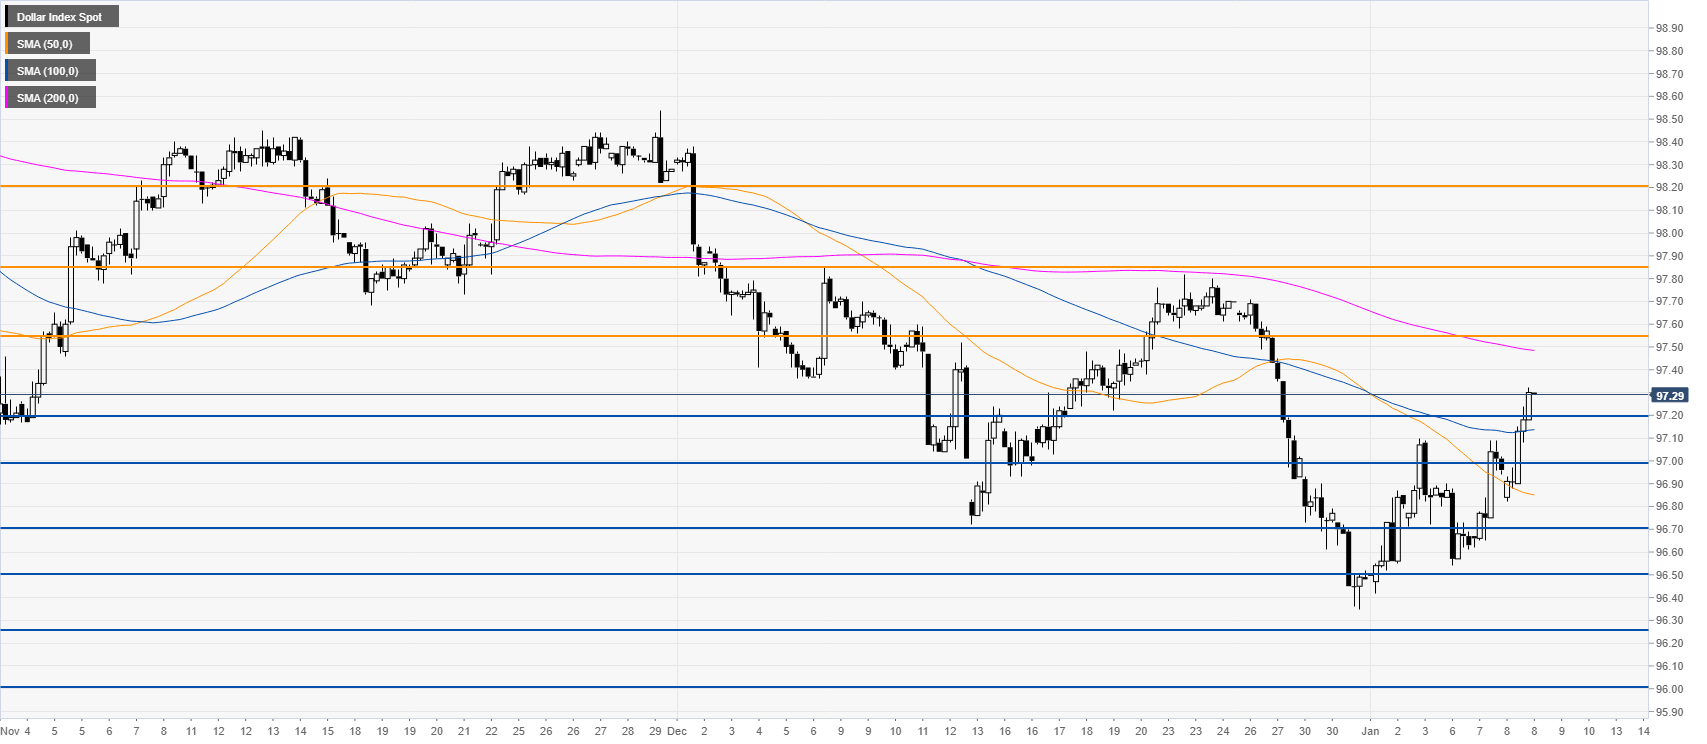
- On the way up, resistance is seen at the 97.55 level.
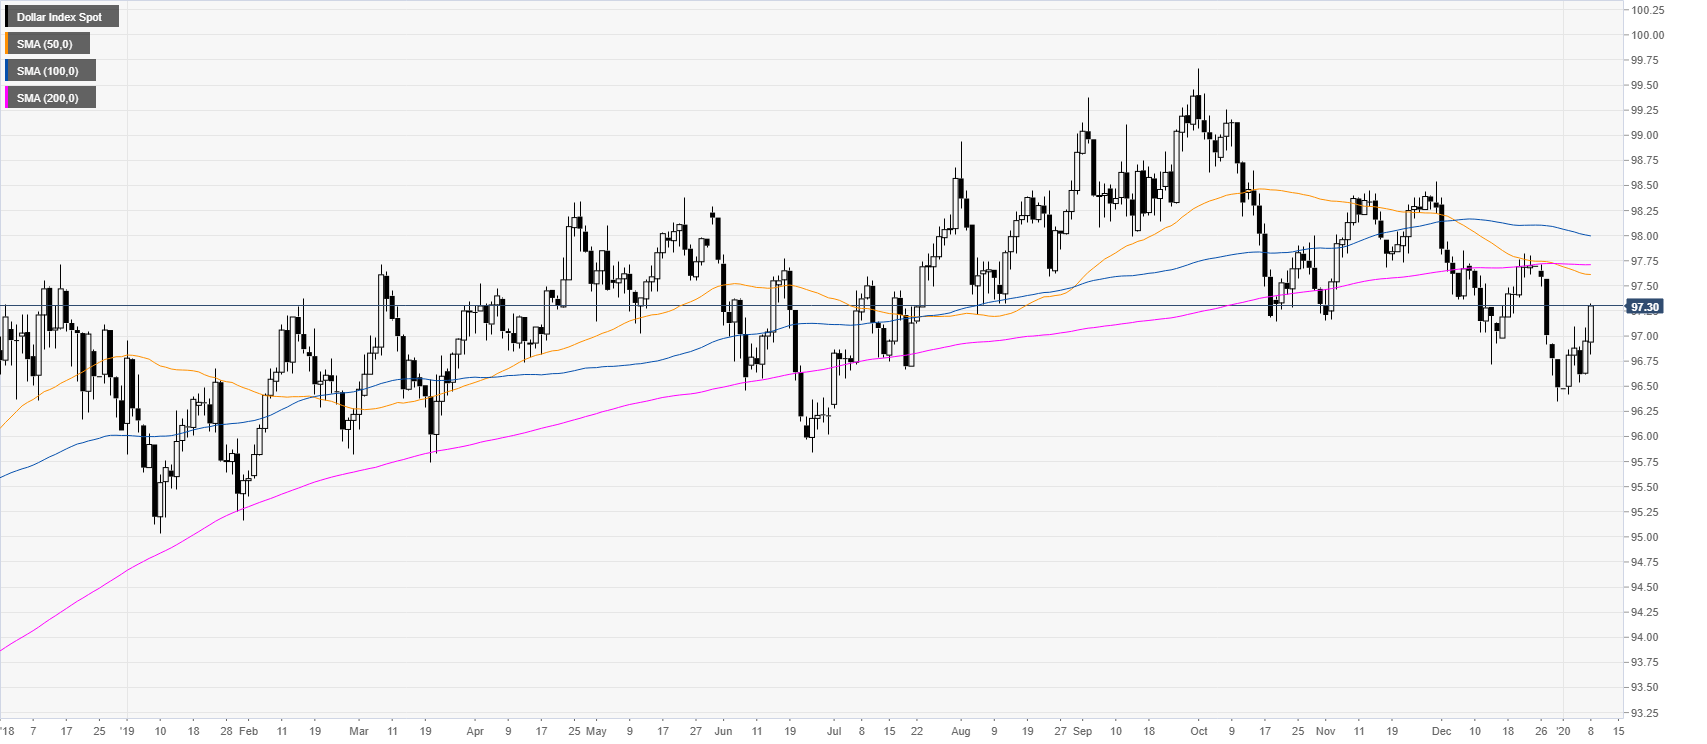
DXY daily chart
The greenback is attempting to bottom out as it is trading below the main daily simple moving averages (SMAs). This Wednesday, DXY broke above the 97.00 handle still trading in a bear channel.

DXY four-hour chart
DXY moved beyond the 97.20 resistance and the 50/100 SMAs on the four-hour chart. As the bulls are seizing control, the market could continue to appreciate towards the 97.55 and 97.85 resistances. However, DXY could remain vulnerable to pullbacks to 97.20 and the 97.00 handle.

Additional key level
